Science
Using Data Assimilation to Study the Migration Patterns of Air Pollution
These days, we have a pretty good understanding of where air pollution comes from: the cars we drive, the factories we run, and the agricultural areas that produce our food, not to mention natural sources such as wildfires. What we don’t always realize, however, is that the pollution in our air may not have come from the neighbor’s car down the street. Instead, it may have come from a vehicle, factory, or another source that lies hundreds—or perhaps even thousands—of miles away.
Scientists are attempting to connect the dots between emissions and their sources, to understand how these factors impact air quality. However, they’re faced with quite a challenge: We can only see pollution in places where we’re measuring it, and we’re not measuring it everywhere, nor are we measuring it around the clock. That leaves gaps in our overall understanding of how pollution behaves over time.
To fill in these gaps, scientists have turned to chemical data assimilation, a relatively new capability that propagates observational data and assesses the evolving state of pollution over time. Using data assimilation techniques, scientists have processed datasets collected by various NASA satellite instruments, including new ozone (O3) data that combines observations from the Atmospheric Infrared Sounder (AIRS) and the Ozone Monitoring Instrument (OMI). Thanks to this data in combination with satellite datasets, scientists found that not only were they able to fill in the gaps, but they were also able to create a crisp picture of pollution as it moves through the air.
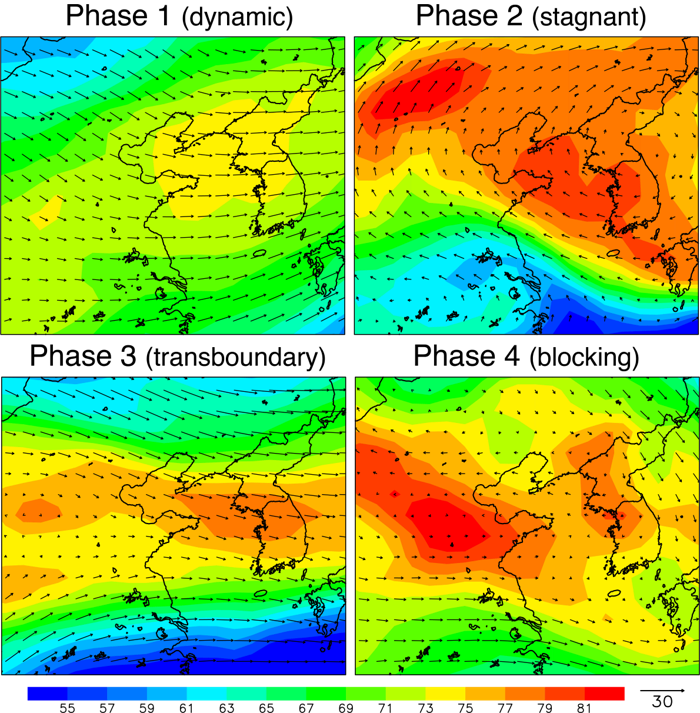
Scientists used that picture in conjunction with findings from a recent air quality campaign, Korea-United States Air Quality (KORUS-AQ), to improve our understanding of how pollution migrates and changes. A targeted field study, KORUS-AQ used satellites, aircraft, and ground sites to collect atmospheric observations and assess the air quality along the Korean Peninsula from May to June 2016. Meteorological conditions varied dramatically during the campaign, so in their chemical reanalysis, scientists divided the campaign into four phases based on the dominant air circulation patterns: dynamic, stagnant, transboundary, and blocking.
What they found is that pollution and where it comes from largely depends on how the air is moving. During stagnant conditions in phase 2 (see figure), when winds were weak, pollution came from local sources and built up over time; scientists saw higher average O3 concentrations—by 30 ppb—over Seoul, South Korea, during stagnant conditions than they did during dynamic conditions. In contrast, when strong westerly winds picked up during phase 3, the air flow created transboundary conditions that rapidly carried polluted air from China to South Korea, reducing visibility and causing extreme pollution (>78 ppbv) in the Korean Peninsula.
There’s more to learn, but thanks to this work, we know that chemical data assimilation and datasets such as those collected by AIRS/OMI can help to drastically improve our understanding of air pollution—which, in turn, will enhance air quality analysis and forecasting in the future.
Citation: Miyazaki, K., Sekiya, T., Fu, D., Bowman, K. W., Kulawik, S. S., Sudo, K., et al. (2019). Balance of emission and dynamical controls on ozone during the Korea‐United States Air Quality campaign from multiconstituent satellite data assimilation. Journal of Geophysical Research: Atmospheres, 124, 387–413. https://doi.org/10.1029/2018JD028912
Mission Highlights
Swipe to view more highlights
Loading mission highlights...