Science
Wildfire Smoke Transport from Canada to US
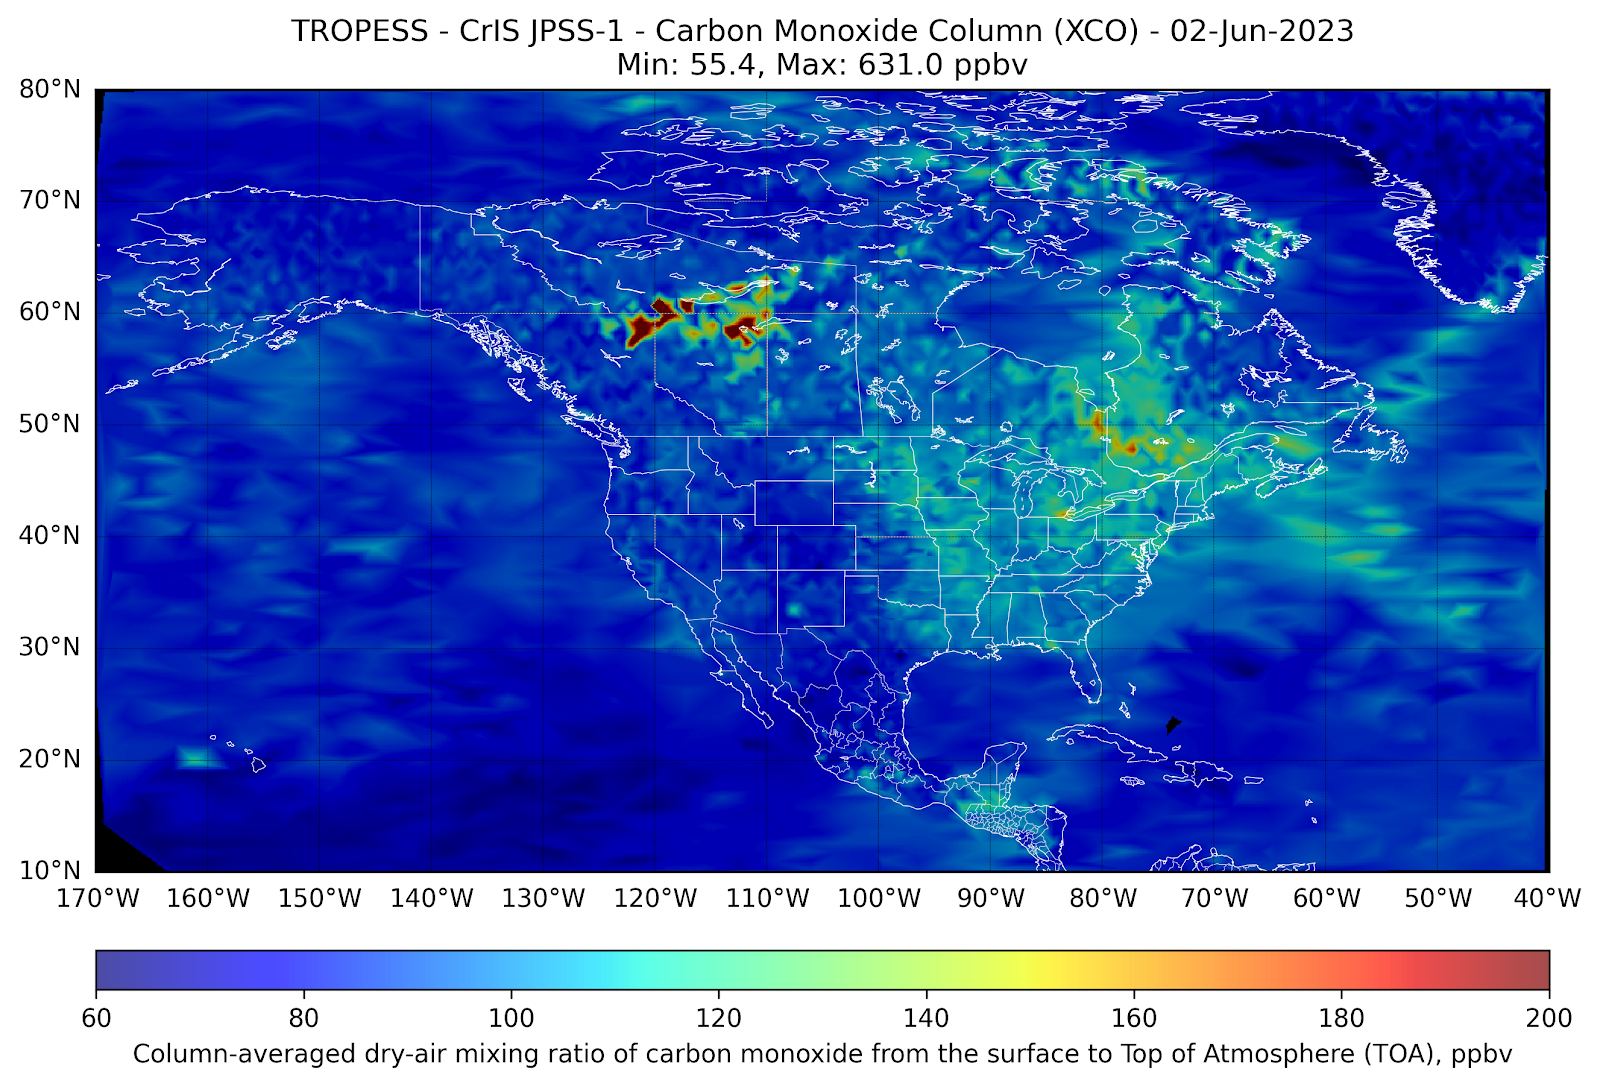
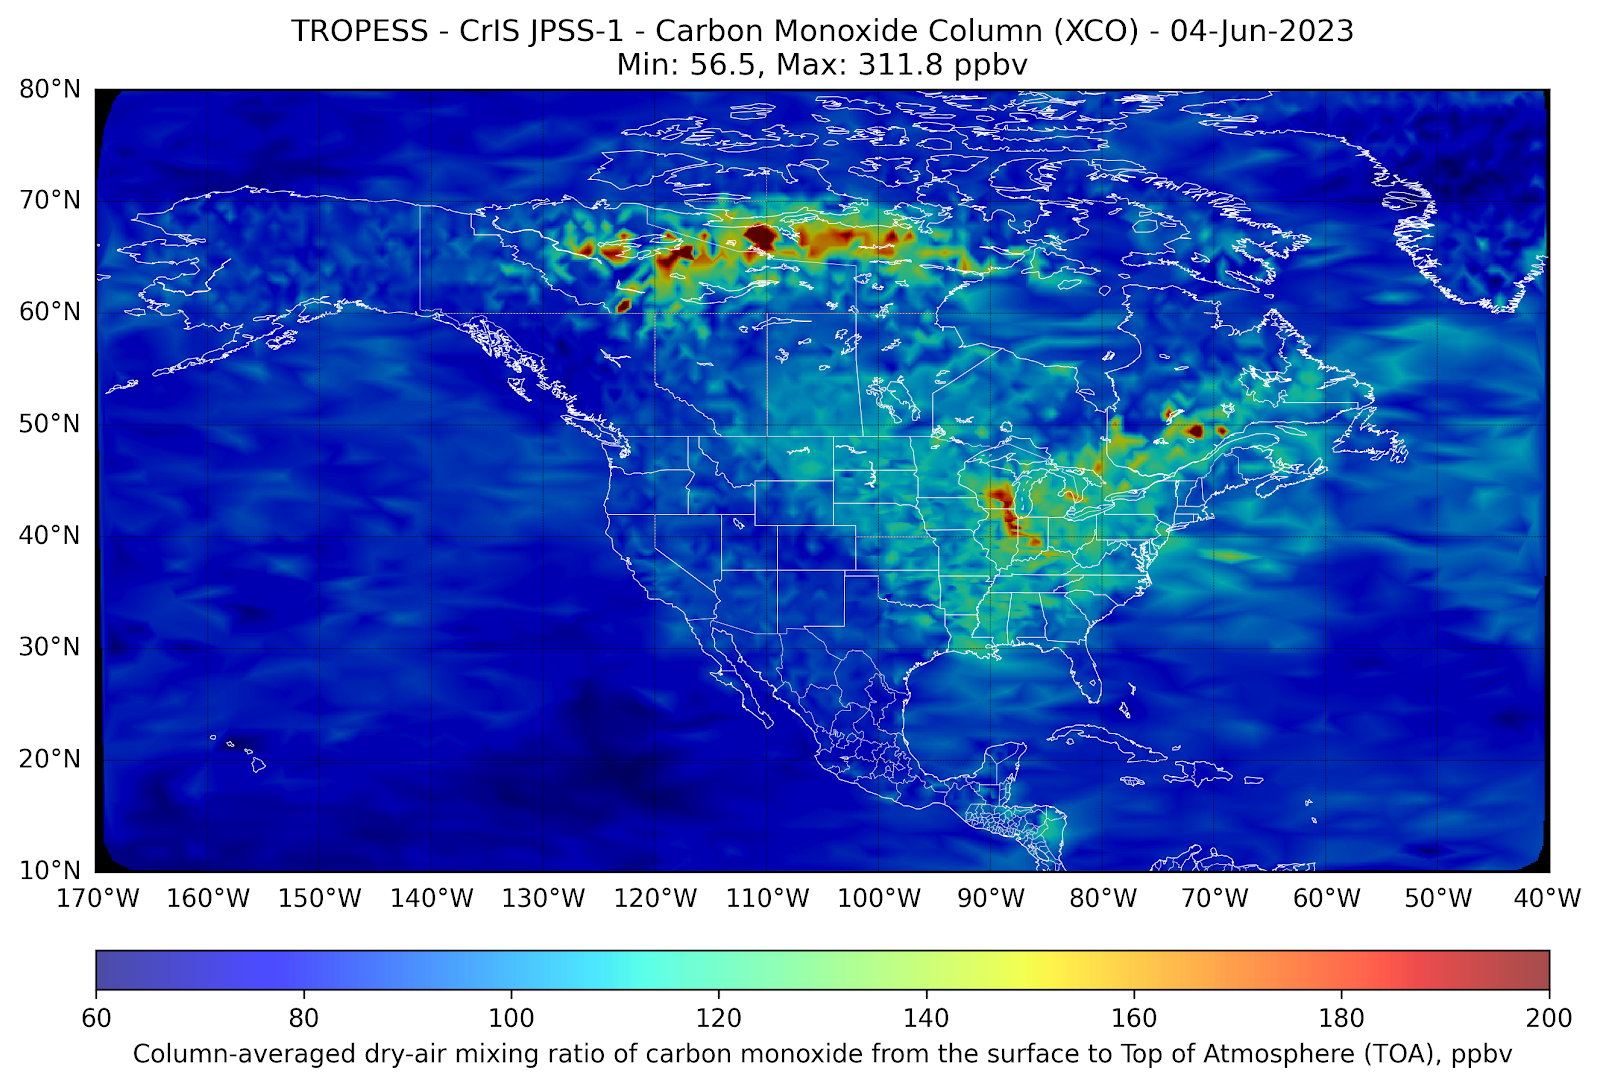
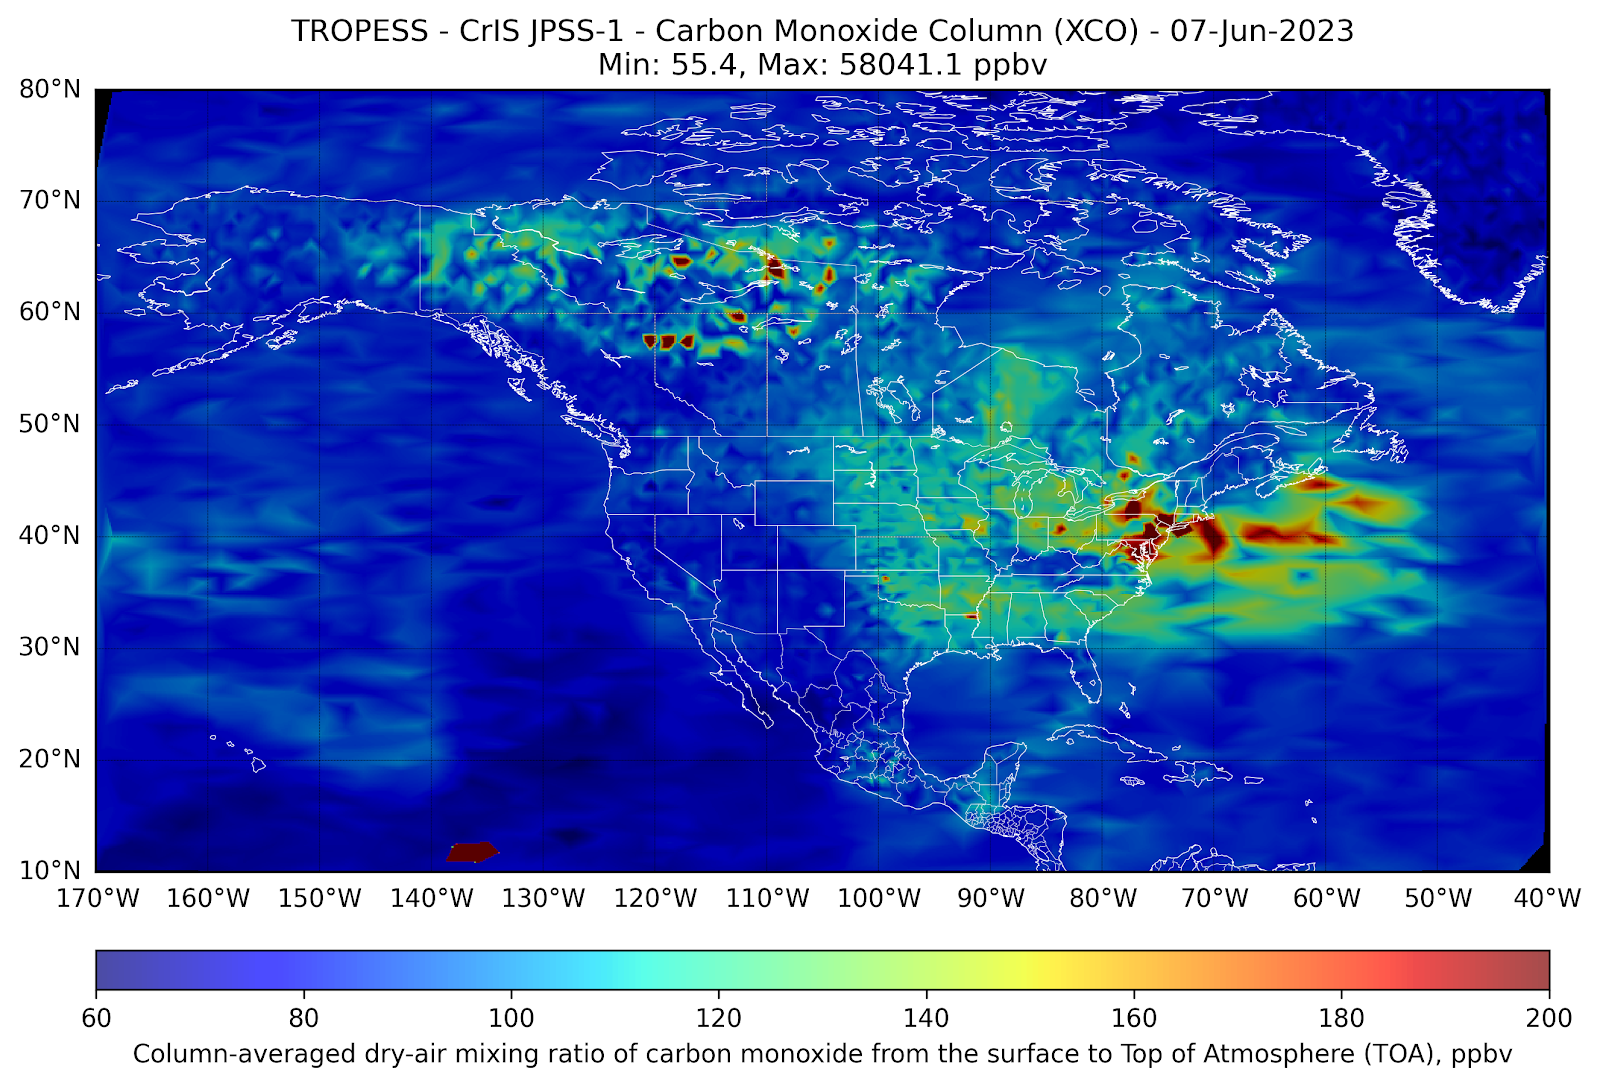
In the first week of June 2023, wildfires in the Great Lakes region of Canada generated vast smoke plumes that have extended into the eastern U.S.
Measurements of carbon monoxide (CO) made by the NOAA/NASA joint JPSS-1 CrIS satellite from 1-8 June (see plots below) illustrate how pollution generated by these fires is transported to the Great Lakes region of Michigan, Ohio, Pennsylvania and New York and creates localized pollution in these regions. As a tracer of combustion, satellite-based observations of CO act as a proxy for atmospheric smoke transport and provide local air quality forecasters an indication of likely impacts to ground-level air quality.
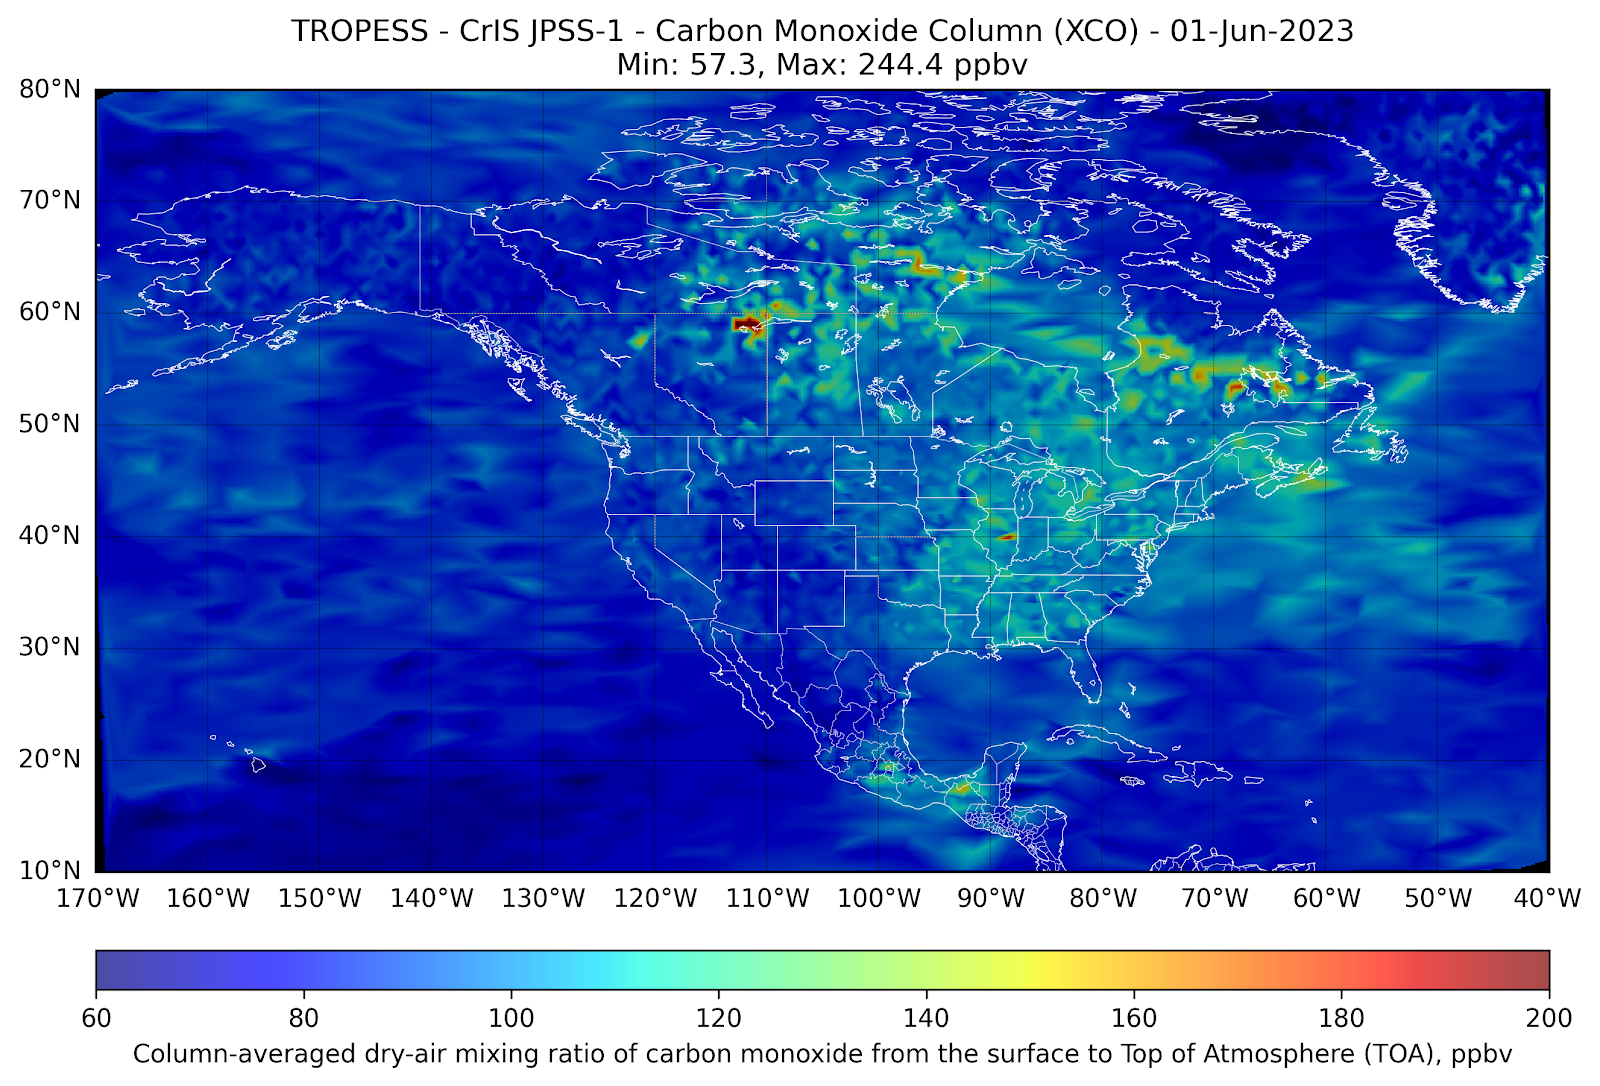


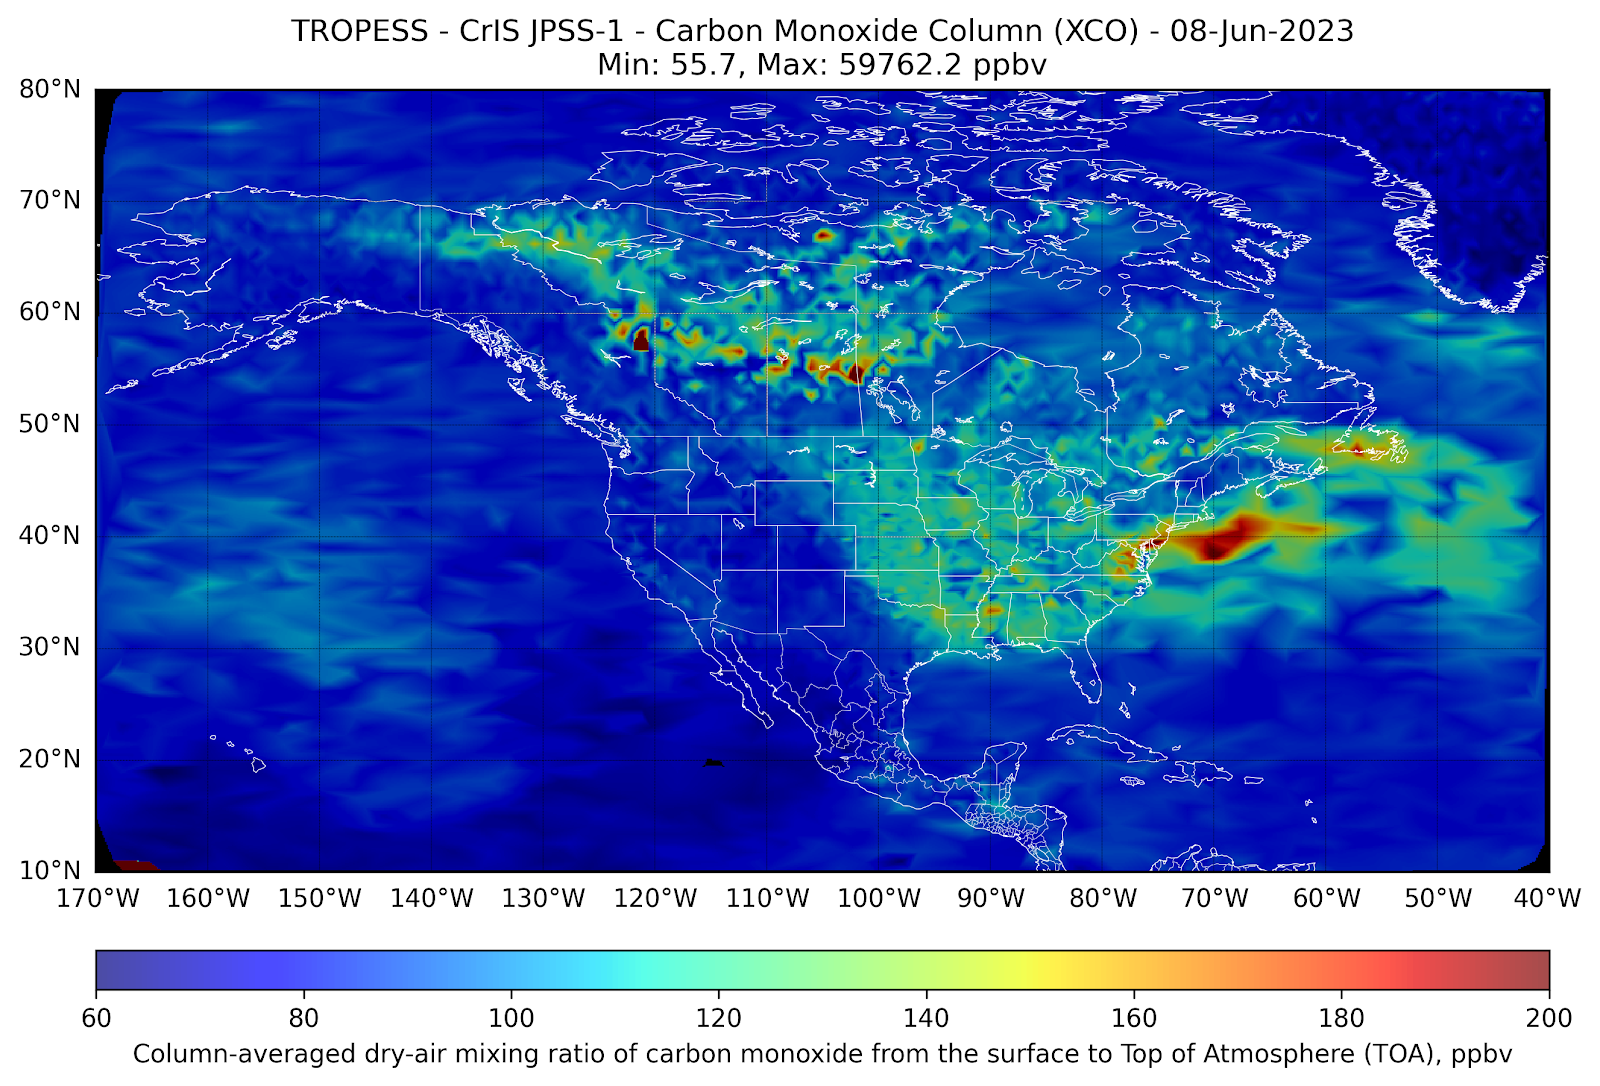
As the satellite-based CO measurements are averaged within the column of the troposphere (roughly the altitude region from the surface to about 100 mbar), scientists utilize complex parameterizations involving these measurements to assist in forecasting surface-level air quality. As indicated in the plots below, the commonly used Air Quality Index (AQI) forecast (https://www.airnow.gov/aqi/) is used to inform the general public about the level of air pollution that may present a health hazard to humans engaged in outdoor activities. When comparing the satellite based-plots to the AQI for each day in New York, NY, the South Coastal Region of New Jersey, and Baltimore, MD, one can make a quick visual inference of the relationship between high CO levels and high AQI in these regions.


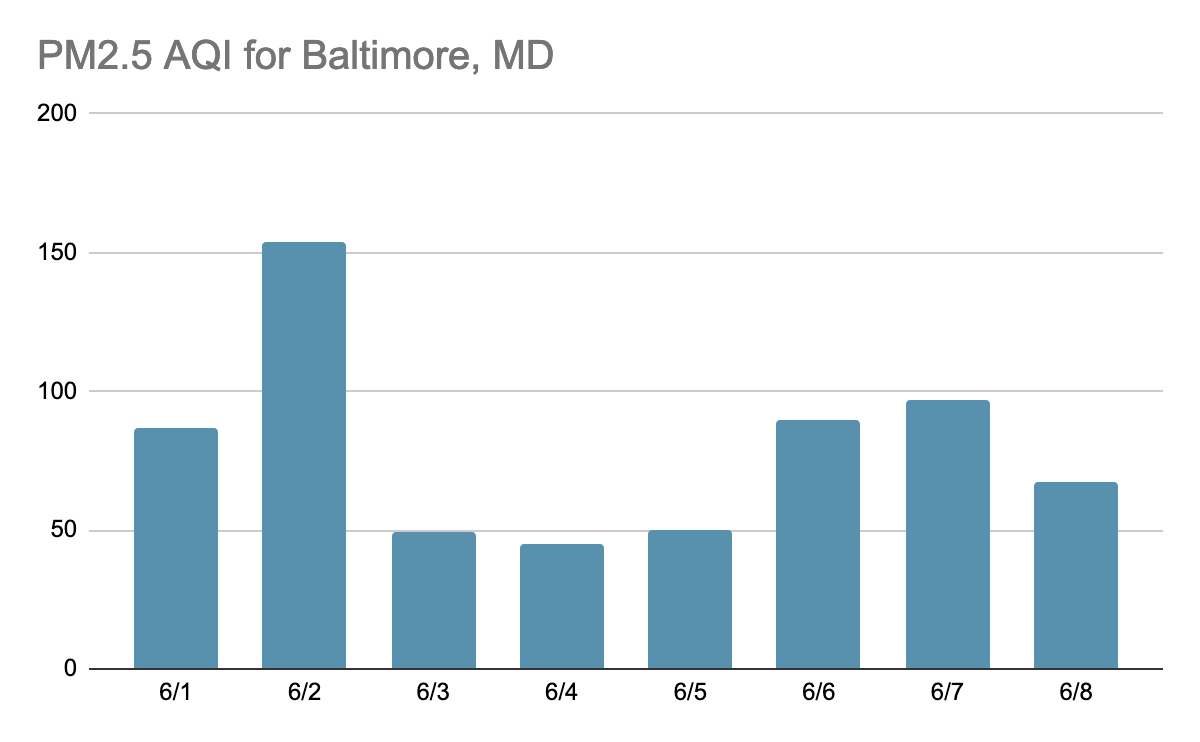

In the animation above, we see the front of large CO values (in red) move from northwestern Canada down towards the Great Lakes and mid-Atlantic regions of the US. When that plume of CO reaches the east coast on June 6th and 7th, the AQI increases compared to the previous days.
Data Citation: Kevin W. Bowman (2022), TROPESS CrIS-JPSS1 L2 Carbon Monoxide for Forward Stream, Summary Product V1, Greenbelt, MD, USA, Goddard Earth Sciences Data and Information Services Center (GES DISC), Accessed: 12 June 2023, DOI:10.5067/JL1HT3NGEAW3
Jupyter Notebook to generate the CO plots
June 2023 Canada wildfire air pollution event afflicts the United States
HAQES Real-time Forecast of the June 2023 Eastern US Air Pollution Event from Canadian Wildfire
Mission Highlights
Swipe to view more highlights
Loading mission highlights...