Get Data
Plots
Time Trends
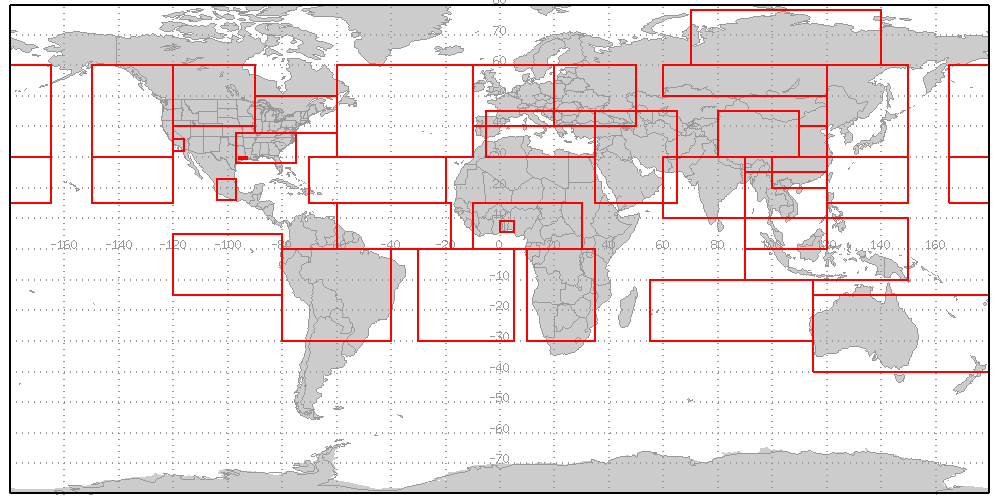
This page provides access to the pressure vs time curtain plots for TES species in a given region via a clickable world map. Each profile on a curtain plot is the average of the profiles from either a Global Survey (< 26 hrs) or a Special Observation (minutes) over the defined geolocation area. Sample footprint plots for eight consecutive Global Surveys in the region are provided.
The plots shown here are using V6 or V7 of TES data, depending on the product.
- South America
- SE Pacific Ocean
- Central Atlantic Ocean
- S Atlantic Ocean
- Africa: Southern Tropics
- Africa: Northern Tropics
- Africa: Lagos
- India/Indian Ocean
- SE Asia
- Indonesia
- Australia
- China: Central Plains
- China: N Central Region
- China: South East
- Southern Siberia
- Siberia
- N Asia / NW Pacific Ocean
- Northern-Central Pacific Ocean
- North-East Pacific Ocean
- Central-West Pacific Ocean
- Central Pacific Ocean
- Central-East Pacific Ocean
- Southern California
- Mexico City Area
- US: South-East
- US: Houston Area
- N Central America
- N East America
- N Atlantic Ocean
- Atlantic Ocean: N Sub-Tropics
- Western Europe
- Eastern Europe
- Mediterranean
- Middle East
- India and Arabian Ocean
Global or regional images displayed here are generated from TES Level 2 data for the purpose of data browsing. Interpolations or averaging was used to calculate values at uniform grids to form the images. Caution is needed when interpreting features displayed in these images and are probably not suitable for quantitative scientific analysis. For further information, please contact Ming Luo.